Basic Operations
This section will walk you through the process of tracing a neuron and some other tasks. It’s meant to introduce you to the basic operations of Horta. Not all features or details of features are discussed. You can find those details in the appropriate Feature section.
Assumptions
Before you get started with Horta, it is assumed:
- The data is available in the proper format.
- If a sample hasn’t been created, you know the file path to the data.
- (HortaCloud) You have a HortaCloud username and password.
- (desktop) The Janelia Workstation is installed, you have a username and password, and you have logged in after launching the workstation. You have set the memory used by the workstation to a large number, preferably 40G or more.
- You’ve read the Concepts section of this documentation.
You should contact whomever prepared your data if you don’t know the answers to the above questions.
Data Explorer and Data Inspector
When Horta is launched (either version), you will see the Data Explorer and Data Inspector at the left edge of the application window.
The Data Explorer panel lists all of the objects in the workstation that the user has permission to view. These objects include both samples and workspaces as well as folders used to organize them.
Single-clicking on an object in the Explorer will populate the Data Inspector with more details about the object. The Attributes tab shows object metadata. Permissions shows current access permission and, via the “Grant permission” button at the bottom, allows the user to share read or write (edit) permissions for the selected object. The Annotations tab is only used in the desktop application for datatypes not available in HortaCloud.
Right-clicking on an object brings up a menu of actions. Most are self-explanatory; others will be described later in this section or in one of the reference sections.
Basic annotation
The most basic workflow for neuron tracing is this:
- Create a sample
- Create a workspace
- Create a neuron
- Add points to the neuron
- When done, export the neuron
Those tasks, and others, are detailed below.
Creating a sample
A sample is the representation of a dataset in the workstation. This only needs to be created once per dataset and can be shared among all users who are annotating that dataset. You need to create a sample in order to view data.
HortaCloud
In HortaCloud, samples are usually already created automatically by the system.- File menu > New > Horta Sample
- In “Sample Name”, enter a name for the sample
- In “Path To Render Folder”, enter the path that the image server will use to locate the images. This should be a Linux-style path.
- (HortaCloud) The sample path will refer to a S3 bucket.
- Click “Add Sample”.
- The sample will appear in your “3D Tile Microscope Samples” in your home folder. You may need to refresh the Data Explorer to see it.
- (optional) Share the data with other users or groups.
Once it’s been created, you may perform any operations on the sample that you can do with any other object in the workstation. For example, you may move, rename, or remove it. See the main workstation documentation for details.
Relocating a sample
If, for any reason, the images for a sample change location or change name, you can update the path stored in the sample without recreating it. Right-click on the sample and choose “Edit sample path”.
Viewing and navigation
Opening a sample
- In the Data Explorer, browse to the sample.
- Right-click the sample and choose “Open in Horta”.
- This option loads both samples and workspaces.
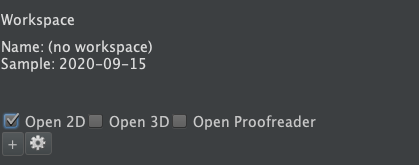
- The sample will open the Horta Control Center, which is typically docked at the right-hand side of the main window. When you open a sample (rather than a workspace), very little information will appear in the Horta Control Center.
- To view the images in the sample, click the checkbox next to “Open 2D” or “Open 3D” in the “VIEWS” section of the Horta Control Center (see screenshot below).
- The viewer (2D or 3D) will open in the center panel. Depending on the data volume, network speed, and disk speed, the data may take anywhere from a few seconds to a few minute to open. The status bar at the bottom of the application will indicate some of the loading steps.
- The 2D and 3D viewers each have their own tab, and you can switch between them freely.
After you’ve created a workspace (see below), use the same procedure to open the workspace.
Viewing and navigating in the Horta 2D viewer
Horta 2D displays the 3D data as a series of 2D planar images. It provides the usual suite of tools for viewing and navigating through the data. When zoomed out, a lower-resolution view of the data is displayed. When zoomed in, higher resolution images are loaded. Annotations are displayed when they are near the plane that is currently being displayed.
HortaCloud 2D data
In HortaCloud, usually only the lowest resolution of the 2D data is available. When a sample or workspace is loaded, a single image of the whole data set will be displayed at the lowest zoom level. If you zoom in, the image will become blurry.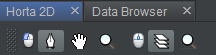
The toolbar at the top of Horta 2D (screenshot above) indicates the current mouse mode. Usually it’s the “pen mode” shown above, which is used for normal annotation. Hover the mouse cursor above each mode to get a description of what they do. This section assumes you are in “pen mode”. Holding down “option” will change to “hand mode” while the key is held down. This mode is useful for navigation.
- To pan the image, hold down option so hand mode is active, then left click and drag the image. Alternately, double-click the image in either mode to recenter at the selected point.
- To zoom the image, do any of: hold down shift and use the mouse scroll wheel, drag the slider to the right of the image, click “Zoom Min” or “Zoom Max”, or (when zoom mode is selected from the toolbar) left-click to drag the area to zoom to.
- To change planes, do any of: drag the slider under the image, click the arrows in the plane number indicator under the image, or scroll the mouse wheel when it is in plane change mode. Note that when you are zoomed out, each click of the mouse wheel will traverse more than one plane.
- Note that holding down the shift key will put the mouse scroll wheel into zoom mode, and releasing the shift key will place the mouse scroll wheel into plane change mode, regardless of the mode the mouse scroll wheel was in when the shift key was depressed.
- The “Reset View” button will recenter the image in x, y, and z and zoom out.
- In the Horta Control Center, the “Go to location…” button allows you to enter an x, y or x, y, z location, and the view will move to center itself at that point. If you don’t enter z, the plane doesn’t change. Commas are optional. Square brackets around the coordinates are ignored.
Adjusting colors in Horta 2D
Controls for adjusting the color of each channel in the image appear below the image, below the plane slider.
Each channel can be shown or hidden (eye icon at far left), and its color can be change (color patch at far right, which will open a color choice dialog).
The three handles on each slider control the range of color mapped to the range of data. The three locks below the sliders will force each of those values to remain in sync across all channel individually.
At the right of each color slider is a button labeled with the number sign #. If you click this button, three text boxes will open up showing the value of the corresponding Min/Mid/Max color slider values. In addition, the calculated gamma is shown. You may type new values into these boxes or use the small up/down arrows if you’d like finer control over them. Note that if you type values into the text boxes, the values will become active if you press return/enter, press tab to move to another field, or click the “Set” button at right.
Note: While it’s impossible to drag the color sliders past each other, it is possible to type values into the text boxes that don’t make sense. Sometimes the slider controls will end up on top of each other. In this case, drag the sliders you can access to a new value. The text values will synchronize and update, and you can then enter values that make sense.
At the bottom of the panel to the right of the 2D view area are two color-related buttons. The “Auto Contrast” button attempts to find a reasonable range of colors based on a simple histogram of the data. This almost never does a good job. The “Reset Colors” button returns the displayed color of each channel to its default value (ie, sliders at maximum, etc.). This is also rarely useful.
Note that the current colors, contrast settings, channel visibility and locks are not saved automatically! You must manually save changes by clicking on the gear menu and choosing “Save Color Model To Workspace” or “Save Color Model As User Preference”. As the desired settings usually depend on the characteristics of the individual sample, usually you will want to save the color model to the workspace, after which it will be automatically loaded when the workspace is opened. However, if you find there is a baseline color model you’d prefer over the default (sliders set to min/middle/max), you may save to your preferences as a personal default.
On the same menu are options for saving or loading the color to/from disk.
Viewing and navigating in Horta 3D
The Horta 3D viewer is opened by clicking the checkbox next to “Open 3D” from within the Horta Control Center. At low zoom, lower resolution images are displayed. When zoomed in, higher resolution images are loaded. Annotations are displayed at all zoom levels.
To move around the volume:
- Single-left click anywhere (including on an annotation): center the volume on that point. Note that if you click on an annotation or near signal, Horta will find the depth in z of the point and center on it correctly. This allows you to follow a neuron by clicking along its length with minimal depth changing.
- Left-click and drag: move the viewpoint in the view plane.
- Middle-click and drag: rotate the volume
- Scroll wheel: change the zoom level
- Right-click anywhere and choose “Reset Horta rotation” if you would like to return to the original image orientation.
- In the Horta Control Center panel, the “Go to location…” button in the “VIEWS” section allows you to enter an x, y or x, y, z location, and the view will move to center itself at that point. If you don’t enter z, the plane doesn’t change. Commas are optional. Square brackets around the coordinates are ignored.
Horta 2D and Horta 3D view synchronization
If both viewers are open, you may synchronize the views by right-clicking on a point in either viewer and choosing “Synchronize Views at This Location”. This command moves the point to the center of the screen in each view. The zoom level is not changed.
Adjusting colors in Horta 3D
Adjusting colors and the general appearance of the data in Horta 3D can be challenging. Horta 3D has been tested and used with one or two data channels. The mixing feature especially may not work with more channels.
Basic settings
To make basic color adjustments in Horta 3D, Windows menu > Horta > Color sliders. In the window that appears, you can adjust color sliders as you would for the Horta 2D. Usually you will want to hide the third channel in this case.
Unmixing
Often the two data channels are used to display a desired signal in one channel and a reference in the other channel. However, fluorescence from the reference channel can also appear in the signal channel. Subtracting it out can make the signal substantially more distinct. To make use of this feature:
- Adjust the signal and reference channels independently (see note below) with the third channel hidden (click the eye to the right of the third slider)
- Right-click and choose Tracing channel > Unmix channel 1 using current brightness (or 2, depending on which channel is which)
- Hide the first two channels and unhide the third
- Adjust the third channel’s contrast and brightness
Note: finding good contrast/brightness settings for the first two channels so the unmixing works well is quite difficult! In general, you should set the channel color slider for the signal channel so the brightest part of the signal (usually the soma) is oversaturated and work from there.
Color model settings are saved as in 2D (see Adjusting colors in Horta 2D above). Note that this saves a wider array of setting than for Horta 2D, including rendering options!
Navigating to neurons or annotations
Once you’ve begun annotation, you can easily navigate to neurons or their constituent annotations (see below for how to annotate).
Neurons: If you double-click on a neuron name in the neuron list, the view will center on the center of the neuron’s bounding box. Note that if a neuron spans a lot of area and you are zoomed in, you may not see any of the actual neuron!
Annotations: If you double-click on an annotation in the annotation list, the view will center on the annotation.
Basic tracing and editing
Annotations are stored in workspaces. A workspace is associated with a sample, which contains the images. You must create a workspace before annotating. Multiple workspaces may be associated with the same sample. For example, multiple people may trace the same neuron independently as a quality control check. Alternatively, a single workspace may be shared among multiple users, usually tracing different neurons simultaneously.
In general, only one tracer should be working on any given neuron at the same time, to prevent one tracer’s work from being overwritten by another’s. Horta attempts to prevent this from happening, but it is possible.
Note Most editing and tracing tools are containing in the Horta Control Center panel at right. If you’re working on a small display, you may need to use the panel’s scroll bar to make some of the lower tools visible.
Creating a workspace
To create a workspace:
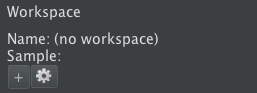
- Open a sample from the Data Explorer; it will appear in the Horta Control Center.
- In the “WORKSPACE” section at the top of the editor panel at right (see screenshot above), click the “+” button.
- Fill in the desired name for the workspace. By default, it has a structured name based on the date and other data. You may optionally click “Manual override” to name the workspace whatever you would like.
- (Note that “Assign neurons” has no effect for this method of creating a workspace.)
- The workspace will be created, and it will automatically immediately load in the Horta Control Center. The workspace name and sample name will appear in the “WORKSPACE” section. The workspace will also appear in the Data Explorer under “Workspaces” in your home directory (you may need to refresh the explorer).
- Once the workspace has been created, you can open it again just like you’d open a sample, by right-clicking the workspace in the Data Explorer and choosing “Open in Horta”.
Operations on workspaces
You can perform a number of operations on the workspace. Some of these operations are common to all data in the workstation; these operations can be performed from the Data Explorer, typically by right-clicking on the workspace. These operations include moving, sharing, renaming, deleting the workspace.
Other operations are specific to Horta. These operations can be accessed by clicking the gear icon in the Horta Control Center, in the “WORKSPACE” section. Most of these will be discussed in other sections.
Save as: If you need to make a copy of the workstation and all the annotations within it, choose “Save as…” from the workspace gear menu. You will be prompted for a new name just as if you were creating the workspace from scratch.
Creating or deleting a neuron
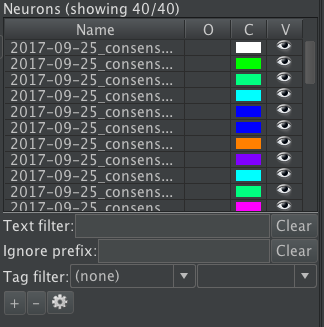
Annotations are contained within neurons. Typically a neuron in Horta represents one biological neuron. Usually its root annotation is placed on the neuron’s soma. Neurons may contain more than one annotation tree, however. For example, it can be convenient to trace large arbors individually and link them later. Neuron controls and the neuron list are located in the “NEURONS” section of the Horta Control Center (screenshot below).
To create a neuron:
- Open a workspace.
- Click the “Add…” button below the neuron list.
- Type in a name for the neuron and click “OK”.
- The new neuron will appear in the neuron list, selected.
To delete a neuron, select a neuron in the list, then click the “Remove” button below the neuron list. You will be shown a dialog box to confirm your decision.
Annotating in Horta 2D
To add points to a neuron in the Horta 2D viewer:
- Open a workspace.
- Create a neuron if one does not exist.
- In the neuron list, select a neuron by clicking on it.
- Be sure you have the pen tool selected in the toolbar; this is the default, and it is rarely changed.
- If there are no points in the neuron:
- Shift-left-click a location to place a point at that location.
- If there are already points in the neuron:
- Select the parent annotation you want to add a child to by clicking on it. The annotation will then be drawn with a “P” on it.
- Navigate to the location of the next annotation, possibly changing planes as you do.
- Shift-click the location where the annotation should be placed.
- A new point will be added, connected to its parent, and the new point will become the parent annotation for the next annotation added. In Horta 2D, this point is marked with a “P”.
- The view will re-center on the new point.
- Continue adding points by shift-clicking
Annotating in Horta 3D
Adding points to neurons in the Horta 3D viewer is somewhat different than in the Horta 2D viewer because of the third dimension. In Horta 2D, when you add a point, it is added at the z-coordinate of the plane you are viewing. In Horta 3D, though, you are looking at a three-dimensional representation of the data, so a mouse-click might correspond to a number of locations in the data corresponding to various depths into the screen.
Snap to signal: However, Horta 3D provides the user with assistance in placing annotations on signal. When you move the mouse cursor in Horta 3D, if it nears a bright signal (hopefully a labelled neuron and not background noise), the mouse cursor will change to a ball with a “+” sign, and it will jump to the center of the brightness automatically. If you shift-click to place a point, that point will be placed in three dimensional space on top of the brightest part of the data. In this way, you can annotate correctly in three dimensions without having to determine the exact depth of the signal manually.
Note that the “snap to signal” feature depends on which image channel has signal, and is therefore channel-dependent! Right-click and choose “Tracing channel” to determine whether signal is sought in the raw channels or a combination of multiple channels (average or unmixing; see above for unmixing details).
The complete procedure is then:
- Open a workspace.
- Create a neuron if one does not exist.
- Open the Horta 3D viewer
- In the Horta Control Center, in the neuron list, select a neuron by clicking on it.
- If there are no points in the neuron:
- Shift-left-click a location to place a point at that location in the LVV.
- (need to replace this with horta 3D version!)
- Navigate to the location you want to annotate in Horta 3D.
- Select the parent annotation you want to add a child to by clicking on it. The annotation will then be drawn with a “P” on it.
- Navigate to the location of the next annotation, possibly rotating as you do. Move the mouse cursor to the location. A ball cursor with a “+” sign should appear.
- Shift-click the location. Note that if there is no bright signal, the “+” cursor will not appear, and you will not be able to place an annotation!
- A new point will be added, connected to its parent, and the new point will become the parent annotation for the next annotation added. This point is marked with a ball with a “P” on it.
- The view will re-center on the new point.
- Continue adding points by shift-clicking
Editing neurons
Horta contains several useful tools for manipulating neurons and annotations. Most of these operations are performed by right-clicking an annotation and choosing from the pop-up menu in one of the viewers. Some of the more commonly used actions are:
Mouse & keyboard actions:
- Set next parent: left-click an selected annotation to set it to be the parent for the next added annotation
- Move annotation: to move an annotation, left-click and drag it to a new location
- Merge neurites: to merge one fragment with another, left-click and drag an annotation on top of another annotation; after a confirming dialog, the two neurites will be linked together between those two annotations
- The first neurite, with the dragged annotation, becomes a branch of the second annotation
- Note! The tolerance for this operation is quite small! This is best done zoomed quite far in.
- Delete annotation: to delete the “next parent” annotation, press the delete key; this acts like the “Delete link” function, below; if no annotation is deleted, nothing happens
Right-click menu actions (as named on the menu):
- Delete link: deletes the clicked annotation; connects the annotation’s parent and child; can’t be used on branch points
- Delete subtree rooted at this anchor: deletes the clicked annotation and all annotations below it in the tree
- Split anchor: add a new annotation located between the clicked annotation and its parent; this annotation can then be dragged to a new location; this is used to annotate more densely after the fact
- Split neurite: break the neurite (neuron fragment) apart by removing the link between the clicked annotation and its parent; the clicked annotation becomes a root annotation
Changing neuron appearance
Color: You can change the color of each neuron’s annotations by clicking on the colored square in the neuron list (“C” column), by right-clicking the neuron in the neuron list and choosing “Change neuron color…”, or by right-clicking on one of its annotations and choosing “Change neuron color…”. In either case, you’ll be presented with a dialog box that lets you choose the neuron color. If you choose “Change neuron color…” from the gear menu under the neuron list, you will change the color of all neurons currently visible in the neuron list.
Visibility: It’s often useful to hide some or most neurons from view. There are a variety of controls for accomplishing that.
Temporary: To temporarily hide all neurons, hold down the “v” key. This function is useful for viewing the data under a neuron, often as it’s being annotated.
Persistent: Neurons can be toggled between visible and invisible (shown or hidden) for the duration of the annotation session (until the workspace is reloaded). There are multiple ways to do this:
- Right-click on an annotation and choose “Hide neuron”.
- Click the eye icon in the “V” column in the neuron list; this column also indicates the current visibility of each neuron (open or closed eye).
- Right-click the neuron name in the neuron list and choose one of the hide/show neurons options (show all, hide all, or hide all except the clicked neuron).
- On the gear menu below the neuron list, choose one of the hide/show neurons options (show all, hide all, or hide all except the currently selected neuron). This will apply to all neurons currently displayed in the list
Note: The difference between the hide/show options on the right-click menu on each neuron in the neuron list, and the gear menu below the neuron list, can be subtle. The right-click options operate on all neurons, regardless of any text filters. “Hide others” and “Show others” act globally on all neurons.
The gear menu options work only on the neurons showing in the list. If there is no text filter active, that means all neurons. So “Hide” and “Show” work on all neurons, but “Hide others” and “Show others” do nothing, because there are no “other” neurons that are not visible in the neuron list (ie, there are no neurons that are filtered out).
When a text filter is active, though, the behavior of the gear menu commands only affects the neurons on the list, or acts relative to the neurons on the list. The “Show neurons” and “Hide neurons” options will only toggle visibility for neurons showing on the list, and likewise the “Show others” and “Hide others” operations only affect neurons not on the list (ie, the neurons that are filtered out).
Filtering neurons
The neuron list usually displays all neurons in the workspace, but its contents can be filtered to a subset of neurons, which is especially useful when the list is long.
- Text filter: As you type characters into the box (2-3 or more), the list will update to show only neurons whose names contain the entered text somewhere in the name. Java regular expressions can be used.
- Ignore prefix: As you type characters into the box, the list will update to show only neurons whose names do not begin with the entered text. Again, regular expressions can be used.
- Tag filter: Neurons can be included or excluded from the displayed list based on their tags. See the “Tags” section in Horta Features.
- Spatial filter: When there are a large number of neurons (hundreds or more), perhaps computationally generated, performance can suffer if all of them are visible. Neurons can be filtered by spatial proximity to a neuron of interest. See the “Spatial Filtering” section in Horta Features.
Note that any actions triggered from the gear menu below the neuron list will only act on neurons that are currently visible in the list! In this way, you can, for example, easily change colors or visibility of a specific subset of neurons.
The sort order of the neurons can be changed by choosing “Sort” from the neuron gear menu.
Filtering annotations
The “ANNOTATIONS” section is located below the “NEURONS” section in the right-hand panel. By default, the list displays annotations that are “interesting”: roots, branch points, end points, and any annotation with notes (see below). Note that the “geo” column is meant to suggest the neuron’s geometry (see below). They are ordered by last update time (newest at the bottom). Only annotations from the currently selected neuron are shown.
| symbol | geometry |
|---|---|
o-- | root |
--- | link |
--< | branch |
--o | end |
Filter menu and buttons: The filter menu lets you switch between several pre-determined filters (with buttons provided to quickly switch to some of those filters without navigating the menu).
Note that some of these filters do not operate the way you’d think! They are designed to assist tracers to locate specific classes of annotations in conjunction with the note system (see below) and one possible workflow.
| filter | included annotations |
|---|---|
| default | roots, branches, ends, annotations with a note |
| ends | endpoint that do not have a note “traced end” or “problem end” (ie, an endpoint that needs to be traced out = unfinished endpoint) |
| branches | has “branch” note (ie, manually marked as a place that should be a branch point) |
| roots | is a root node |
| notes | has any note |
| geometry | roots, branches, ends |
| interesting | has “interesting” note |
| review | has “review” note |
Filter text: As you type characters into the box, the list will update to only show annotations whose note contains the entered text somewhere in the note. Regular expressions may be used. Note that this filter also operates on the “geometry” column! For example, if you type o–- in the text filter, you will only see root annotations. This can also be done via the menu (above), but it may be useful in some cases.
Adding notes (text annotations)
Arbitrary text notes may be added to any annotation. To bring up the dialog box for adding, editing, or deleting notes: right-click on the annotation and choose “Add, edit, or delete note…”, double-click on the “note” column in the annotation list corresponding to the annotation, or select the annotation and press the assigned keyboard shortcut. In the dialog that pops up, you may enter any text you like. You may also edit or delete the note from this dialog.
Predefined notes: There are a set of buttons that insert predefined notes (such as “branch”, “interesting”, and “review”). The predefined notes interact in important ways with the annotation filters. The details are described in the “Notes” section of Horta Features.
Notes are imported and exported along with the neurons (see below).
Changing neuron ownership
There are two kinds of ownership in Horta. First is the ownership that is managed by the Janelia workstation itself. The items that appear in the Data Explorer (workspaces and samples) are shared using the “Permissions” tab in the Data Inspector window. A tracer must have write access to the workspace before annotating. (This is usually only relevant when sharing workspaces. A tracer always has write access to workspaces they create.)
The ownership of individual neurons, by contrast, is managed within Horta itself. The “O” column of the neuron list displays an icon corresponding to the neuron’s owner: an icon of a head for another user, an icon of a computer for a generic “system” group, and nothing (no icon) for the current user. In all cases, if you hover your mouse over the icon (or empty space without an icon), a tooltip will show the full name of the owner.
First of all, most operations are prohibited when a neuron is owned by another user or a group that the current user is not a member of. This includes adding or deleting points or notes. Changing color or visibility is allowed, however, and those changes will not be seen by others.
Second, if a neuron is owned by a group, then any member of that group may make any changes to that neuron. When they do, they will also become the owner of the neuron automatically.
You may change the owner of a neuron if you own it, you are a member of the group that owns it, or you are designated as an administrator of the group that owns the workspace.
To change the owner of a neuron, single-click in the “O” column corresponding to the neuron in the neuron list.
This will be an icon or an empty space. From the dialog box, choose a new owner (user or group) for the neuron. To change the owner for multiple neurons, filter the neuron list to the desired set of neurons, then choose “Choose neuron owner…” from the gear menu under the neuron list.
Admins in the system may change any neuron’s owner at any time.
The gear menu in the “WORKSPCE” section contains the very dangerous “Temp ownership admin” checkbox which gives the user the ability to change neuron ownership as if they were an admin (but grants no other admin privileges). Use this sparingly! It’s intended for use by a trusted and professional group to circumvent situations where a neuron owner is, eg, on vacation, and no admin is available to change it.
Exporting data
Horta use the SWC file format for importing and exporting neuron data. It’s a multi-column text file that records the position and connectivity of the neurons and not much else. Note that an SWC file may contain more than one neuron or neuron fragment.
- To export all of the neurons in a workspace, choose “Export SWC file” from the gear menu in the “WORKSPACE” section.
- To export one specific neuron, right-click on the neuron name in the neuron list and choose “Export SWC file…”.
- To export all neurons in the neuron list (potentially filtered), from the gear menu in the “NEURONS” section, choose “Export neurons…”.
Output files: In all cases, you will be prompted to choose an output location for the exported neuron(s).
- If you are exporting one neuron, it will be saved in the chosen location.
- If you are exporting more than one neuron, two versions of the data will be exported:
- A single SWC named for the workspace that contains all of the neurons.
- A folder named for the workspace that contains one SWC file for each individual neuron.
Options: When exporting neurons, there are two options on the right side of the location choosing dialog box:
- Point density: This option can be ignored unless you are using automatically traced paths (described elsewhere). Click “Help” for more info.
- Export notes: When this option is checked, any notes (text annotations) on the neuron are also exported in a JSON file. The file has the same name as the SWC file but uses the .json file extension instead of .swc.
See the Horta Reference section for details on the SWC and note file formats.
Importing data
SWC files may be imported into Horta either interactively or in the background. Because importing large numbers of neurons can be time-consuming, importing more than a dozen or so neurons should be done in the background if you want to use Horta while the files are imported.
Interactive
Because an SWC file may store one or more than one neuron per file, and in Horta, you may have multiple neuron fragments per neuron, there are two ways to handle the import. Both of these options are found on the gear menu in the “WORKSPACE” section.
- Import SWC file as one neuron: This option reads all neurons in the SWC file(s), creates a single neuron, and places all neurons in the file in the newly created neuron (as what Horta calls neurites).
- Import SWC file as separate neurons: This option reads all neurons in the SWC file(s) and creates one neuron per root in the file(s).
Multiple files: In either case, you may choose either a single SWC file or a folder containing multiple SWC files. In the latter case, all SWC files in the folder are imported. Files in subfolders are not imported.
Note: If the SWC file was exported from Horta and has an associated .json notes file, the notes will automatically be imported with the neurons.
Background
SWC files, especially large numbers of them, may be imported into a workspace that will be created for them in the background (on the server).
The SWC files to be imported must be collected in a folder that can be read by the workstation server.
- Right-click on the sample in the Data Explorer
- Choose “Import Linux SWC Folder into new Workspace on Sample”
- Give the new workspace a name in the first dialog box
- (optional) Click the “Assign Neurons” box and provide a user or group that will be the owner of all the newly imported neurons
- In the second dialog, enter the Linux file path to the folder containing the neurons.
- (optional) There is a redundant check box to assign all neurons to the default common user group. In principle, this can be done from the previous dialog box as well.
- After clicking OK, the import process will begin. It may show its progress in the “Background Tasks” tab.
- Do not attempt to load or use the workspace until the task completes!
Note that the import process will continue (on the server) even if you quit the workstation!
Important note: Unlike the interactive case, subfolders are recursively traversed, and all SWC files are imported!
HortaCloud imports and exports
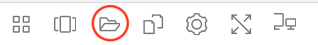
Because HortaCloud running via AppStream does not have direct access to the computer’s hard drive, a two-step process must be used for importing and exporting SWC files and their associated JSON notes files. The process uses the “My Files” location in AppStream, which is a location for temporary files that last for the length of an AppStream session. If you click on the “My Files” folder icon on the top AppStream toolbar (screenshot below), a dialog box will open up. If you click on “Temporary Files”, it will open a folder where you can upload (via the button or by dragging) or download files (by clicking the downward-pointing arrow next to the filename). This “Temporary Files” location is visible from Horta, within any file dialog. So the process for importing SWC files is:
- Open “My Files”, then “Temporary Files”.
- Upload SWCs by clicking “Upload Files” or by dragging.
- In Horta, choose one of the SWC import options (see above), and navigate to “Temporary Files” in the file dialog.
Export works the same way, in reverse: export to “Temporary Files”, then download from there.
Feedback
Was this page helpful?
Glad to hear it! Please tell us how we can improve.
Sorry to hear that. Please tell us how we can improve.